 Mike Yee
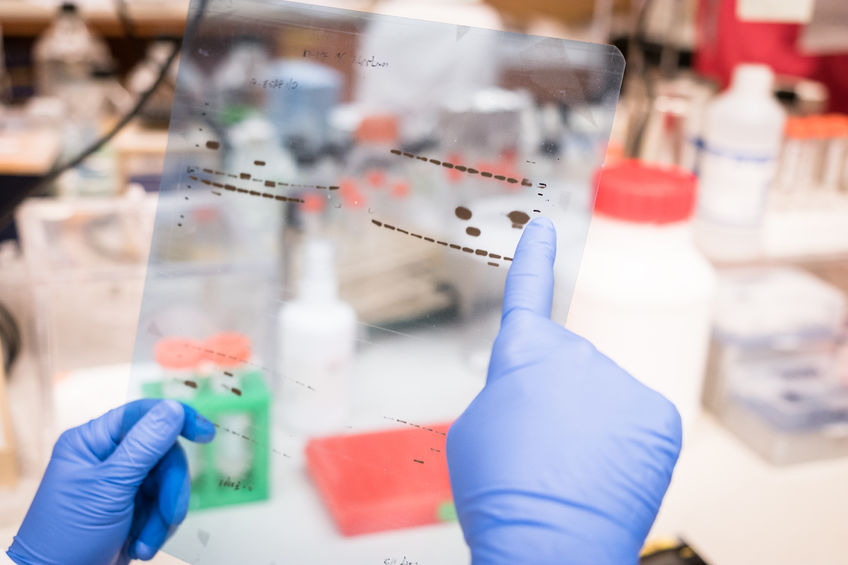
Western blot analyses may not be the easiest experiments to perform. They are not for the faint of heart—akin to a challenging hike up a steep climb on a trail through Yosemite National Park. There can be switchbacks, lots of mud, and slippery slopes, but the beautiful view of waterfalls, majestic peaks, and nature’s colors are stunning to behold.
As with a tough hike, each Western blot step builds upon the previous and must be carefully performed to avoid slipups. A scientist has to isolate and properly prepare the samples, make or purchase the appropriate gels, run the samples through gel electrophoresis, transfer the protein onto the membrane, incubate with the selection of antibodies, and image the results. It is with this last portion of the Western blot protocol where I have recently used a handy method to more easily visualize and analyze results. This article will detail how my lab used infrared dyes along with the Li-cor imaging system to improve and expedite our research.
With this system, we chose two targets: phosphor-cofilin and total-cofilin. We had the appropriate antibodies that targeted each separately—one raised in rabbits and the other raised in mice. After incubation with the primary antibodies in separate steps and washing with the wash buffer, we then incubated with the secondary antibodies. These are antibodies conjugated with fluorescent infrared (IR) dye 680 or 800—one anti-rabbit and the other anti-mouse. Incubation with these secondary antibodies requires just a small amount, from 1:20,000 to 1:40,000. We then brought it over to the Li-cor Odyssey machine to image.
Using the Odyssey software, all we had to do was switch between the channels to view the results for phosphor-cofilin or total-cofilin. Even though the bands are close together and shifted slightly, we were able to clearly distinguish between them and separately quantify them by outlining the region of interest (ROI) at 680 or 800. We also did not have to strip the membrane and re-incubate with antibodies, unlike other methods. Instead, we were able to just run these samples and analyze the same membrane. After quantifying the cofilin bands and saving that data, we could continue to incubate the membrane with antibody for a loading control such as actin or vinculin for cell samples. For this, we could cut off the portion of the membrane where those loading controls would land, and preserve the cofilin section as untouched.
We ran repeats of the experiment, and with each one, it was apparent that half of the typical work was reduced because we just analyzed one membrane for two targets of interest. The key is resolution. The huge advantage is that you can distinguish two bands that are very close together, and that’s why this is a very powerful method for analyzing signal transduction such as phosphorylation of ERK, JNK, Akt—and much more. Furthermore, you can see how this approach can be used for In-Cell Westerns to analyze protein expression of two targets, or signal transduction in cells.
At the end of the day—or a couple days, depending on your incubations—you’ll hopefully have rows of bands that are just as beautiful or majestic as the views on a hike. Or, like me, you’re just proud to be a pipette-wielding lab nerd.
Quartzy is the world’s No. 1 lab management platform. We help scientists easily organize orders, manage inventory, and save money. We’re free and always will be. Visit Quartzy.com or reach out at info@quartzy.com.
Interested in writing for The Q? Send us an email!
Share this:

mikecyee
Mike has a Ph.D. in Biomedical Sciences from the University of California, Riverside, a M.S. in Cell and Molecular Biology from San Francisco State University, and a B.A. in English from the University of California, Berkeley.